BUSY BUREAU
Websites, Apps & Marketing
Philippines — working with the UK, Europe, US & AU

Education · Philippines

A whole campus system that runs in the visitor's browser.

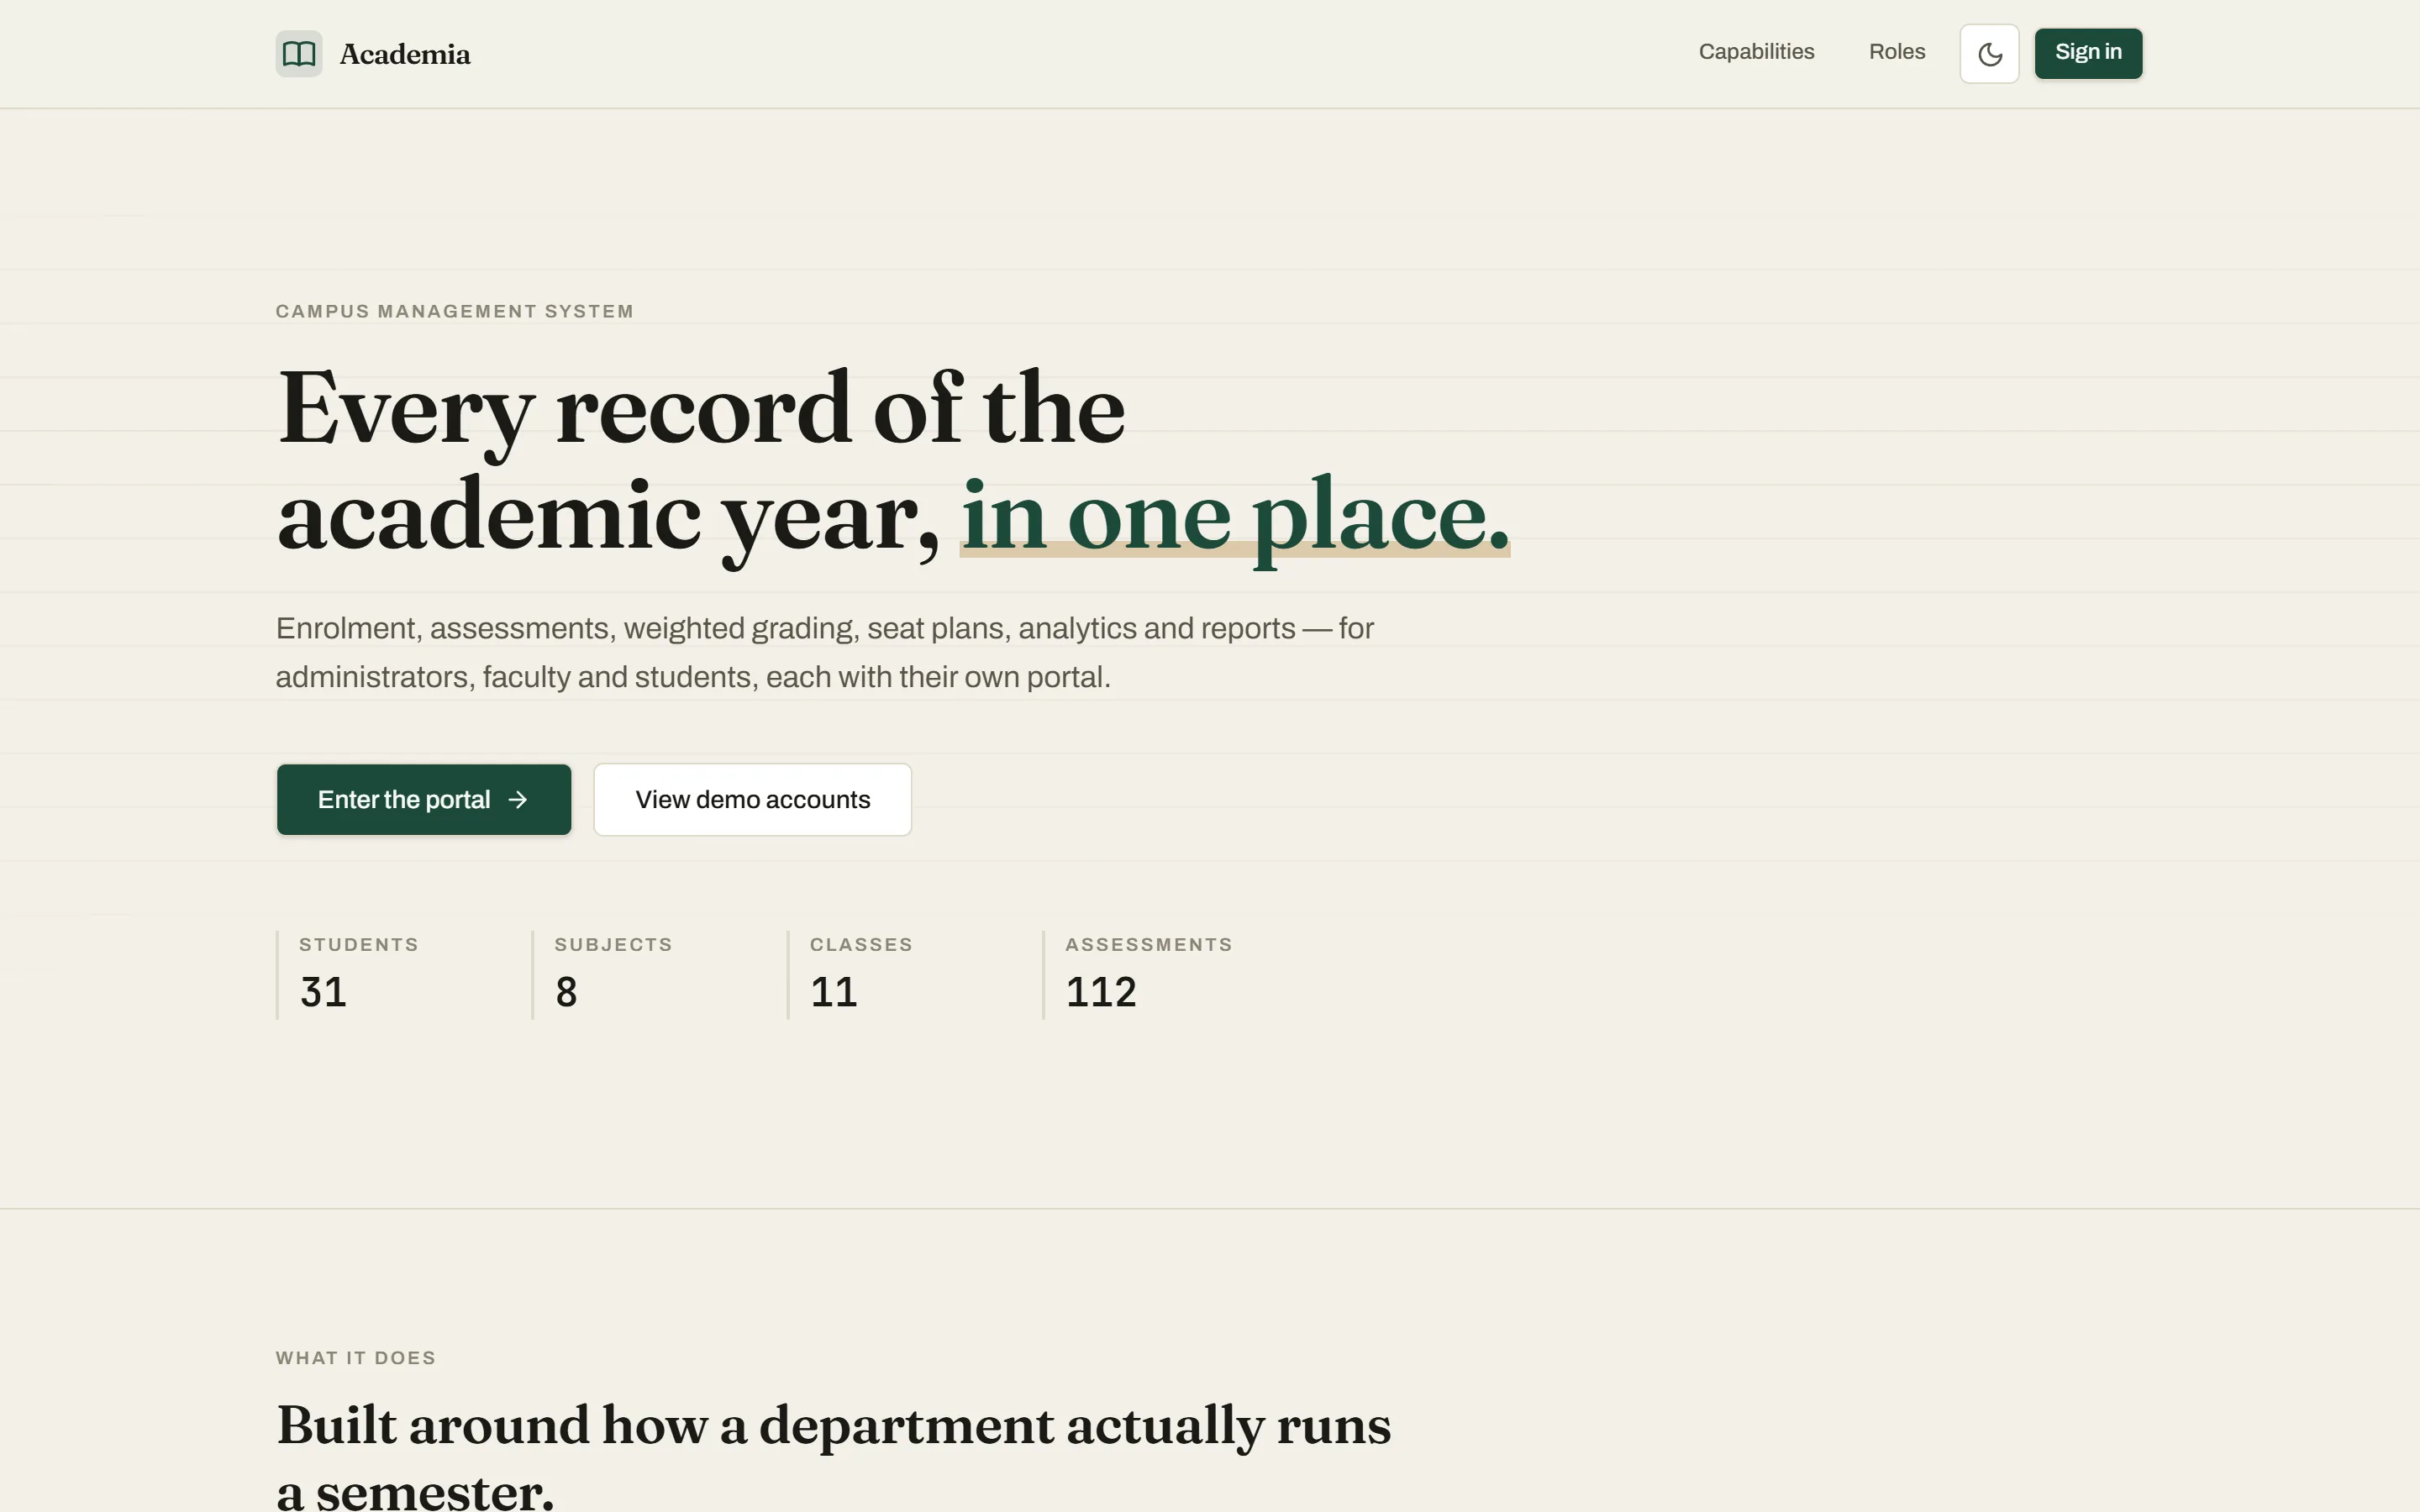
Enrolment, assessments, weighted grading, seat plans, analytics and reports for administrators, faculty and students — rebuilt from Laravel so every visitor gets their own private copy of the data.

Open the live site ↗(opens in a new tab)Overview

Client
Academia
Sector
Education
Where
Philippines
What it is
Campus management portal
What we did
Next.js rebuild · Grading logic · Interface design · Verification
Built with
Next.js 15 · React 19 · TypeScript · Zustand · Tailwind CSS · Recharts · Vercel
The Academia campus management homepage
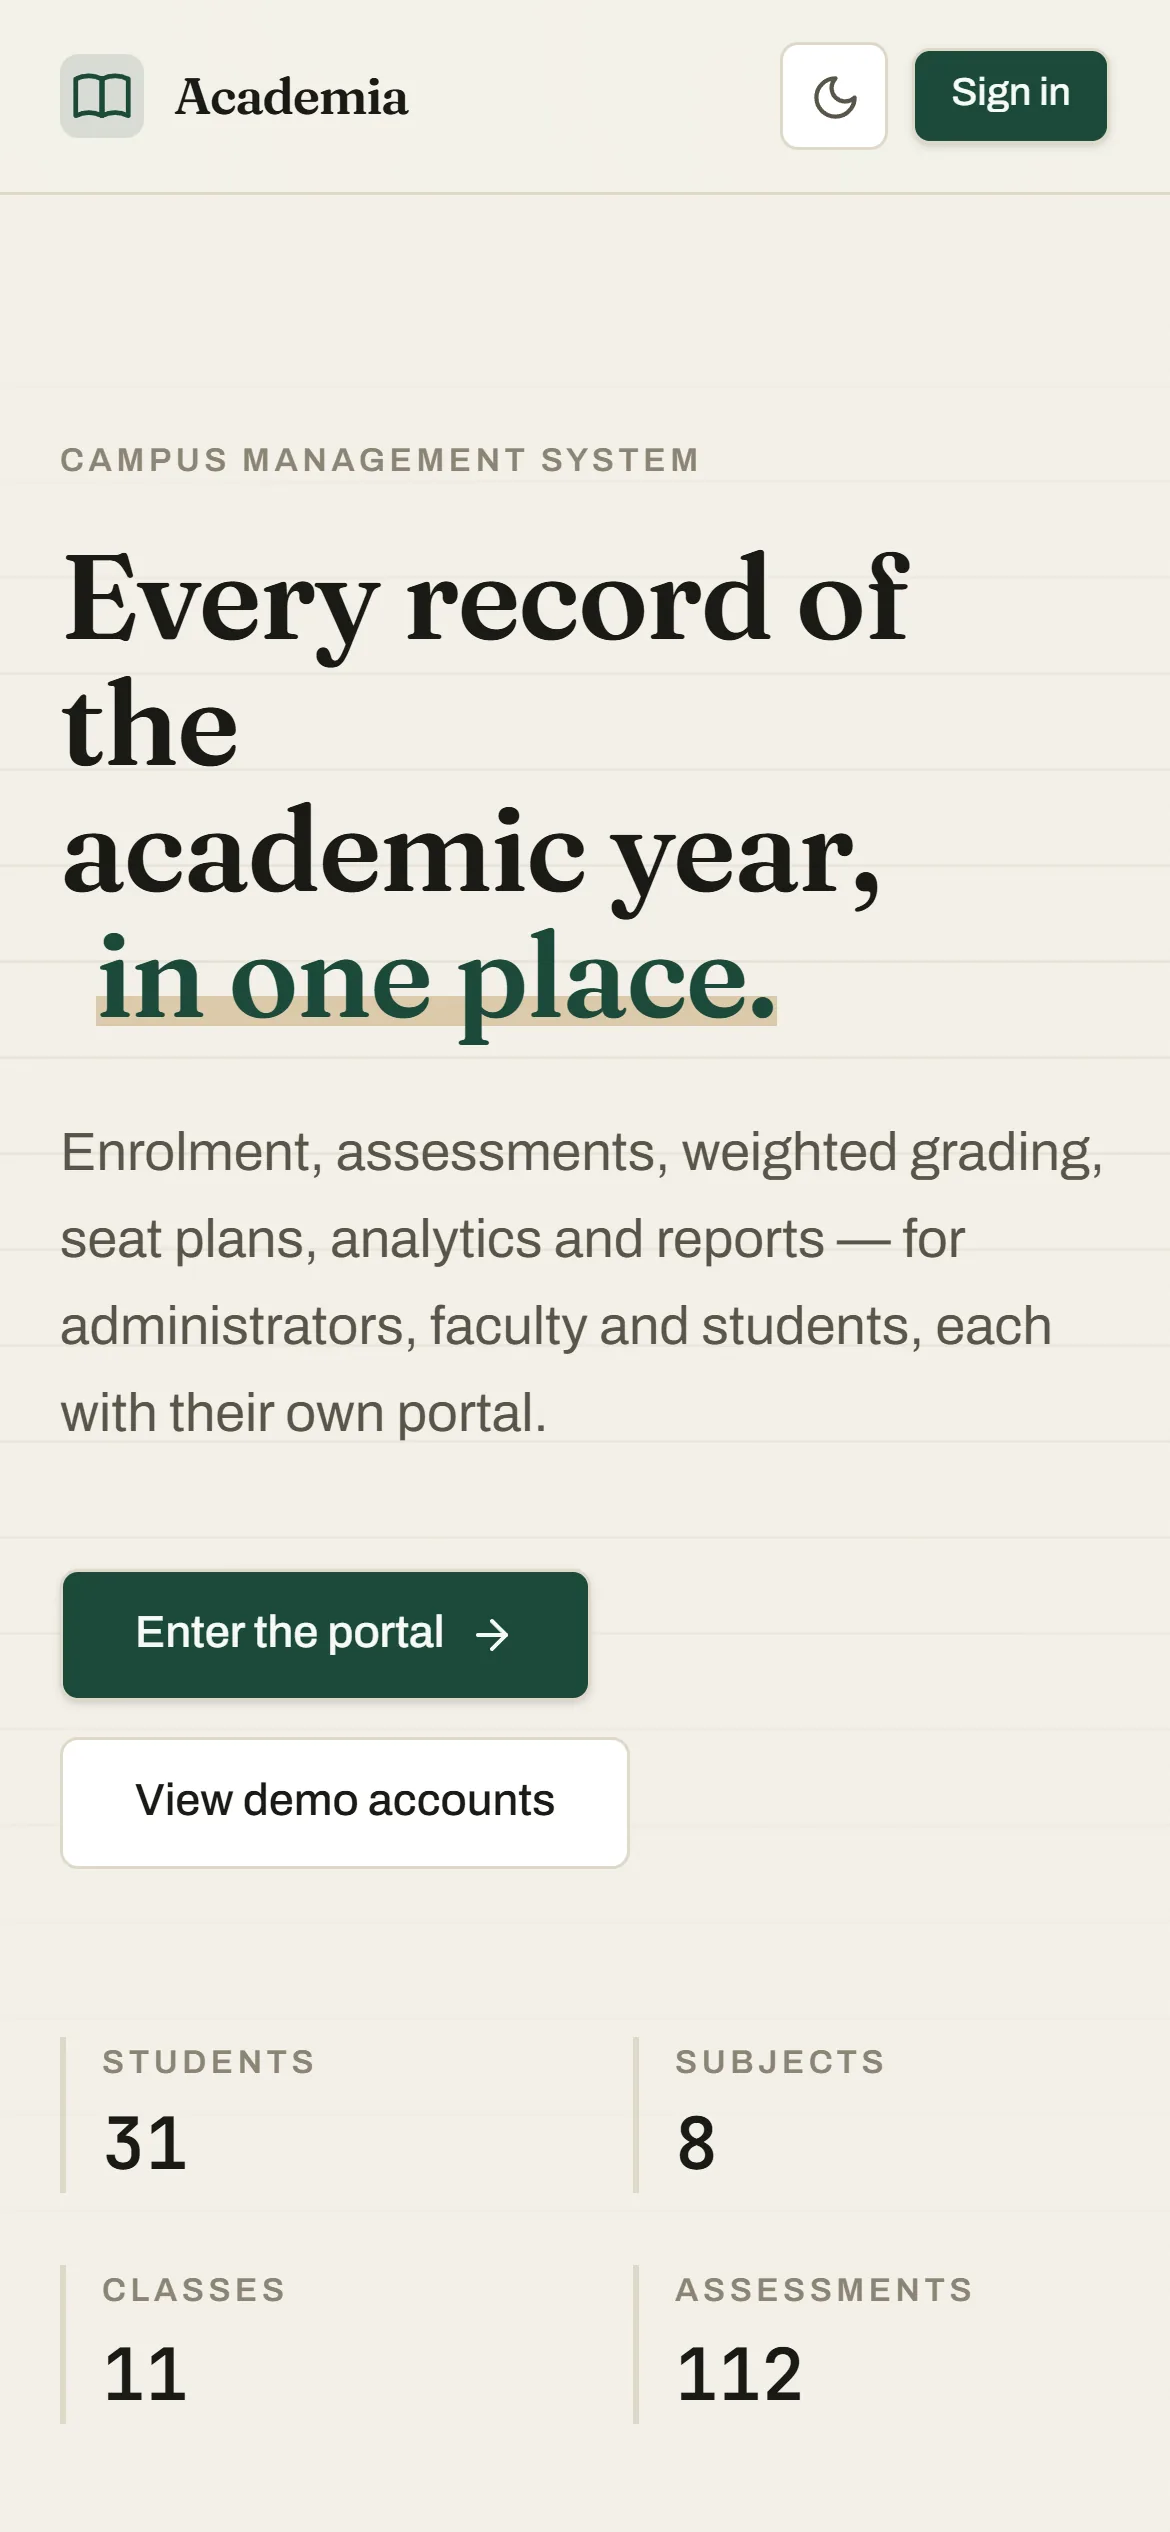
The Academia homepage on a phone
Portals: administrator, faculty, student
3
Screens across the three portals
40
Tables in the data model
12
Automated checks on grades and data
111
01 — Overview
The problem

A department's semester lives in too many places: the roster in one spreadsheet, scores in another, seat plans on paper and grading weights in somebody's head. A demo of a system like this has a problem of its own, too — on a shared database, one visitor's changes are the next visitor's mess.

What we built

Three portals over one model. Administrators keep the directory, subjects, sections and grading weights; faculty schedule assessments, record scores, build seat plans and generate reports; students follow their grades and message the people who teach them. It began as a Laravel and MySQL university capstone and was rebuilt in Next.js, with the whole relational model shipped as seed data and kept per visitor in the browser — so everyone gets a private, writable copy they can reset from the sidebar.

02 — The journey

How a semester runs through it

From setting up a subject to printing the grade sheet, in the order a department actually works.

  1. 01

    Set up

    The administrator creates subjects and sections, and sets grading weights that must total 100%.

  2. 02

    Enrol

    Cohorts are enrolled into classes by school year and semester.

  3. 03

    Assess

    Faculty schedule quizzes, unit tests, activities and exams, each tied to a midterm or final term.

  4. 04

    Score

    Scores go into a sheet that checks every entry against the assessment's maximum.

  5. 05

    Grade

    Weighted grades recompute the moment scores land. 75 passes.

  6. 06

    Report

    Grade sheets and summaries print to PDF or export as CSV.

03 — Features

What it does

01

Enrolment and directory

Students, faculty and sections, with cohorts enrolled into classes by school year and semester.

02

Assessments

Quizzes, unit tests, activities and examinations, each scoped to a midterm or final term.

03

Weighted grading

Set the weight of every assessment type per subject; grades recompute as soon as scores are recorded.

04

Seat plans

Lay out the room, drop each student into a seat — or auto-fill alphabetically, or shuffle — and keep it with the class record.

05

Analytics and reports

Pass/fail, grade distribution and per-assessment averages, then class grade sheets printed to PDF or exported as CSV.

06

Messaging

Students reach the faculty who teach them; faculty reply from one inbox with unread counts.

04 — Up close

How a term grade is worked out

Every subject sets its own weights for four kinds of assessment. Change the weights or the averages and watch the term grade move.

Quizzes
Unit tests
Activities
Exam
Weights total100%
Term grade80.10

PassingPass mark 75

An illustration of the system's weighting model: weights must total 100%, the overall grade is the average of the midterm and final terms, and 75 passes.

05 — Under the hood

The hard parts, and how we solved them

01

A database with no server

What made it hard

A public demo on a shared database fills up with other people's experiments, and serverless hosting has nowhere writable to keep one anyway.

How we solved it

The whole relational model ships as versioned seed data and is persisted per visitor in the browser. Everyone gets an isolated, writable copy; a newer seed version replaces an old copy, and a reset button restores it.
02

Classes in progress showed as failing

What made it hard

The original averaged midterm and final terms as written — so before finals were marked, an ungraded term counted as zero and whole classes appeared to be failing mid-semester.

How we solved it

A separate current grade computed over graded terms only, with the original figures still shown beside it and the report saying so.

03

Server features, rebuilt for the browser

What made it hard

The Laravel version leaned on server libraries for PDFs and Excel files, and polled the server for new messages every minute.

How we solved it

A print stylesheet replaces the PDF library, CSV files carry a byte-order mark so Excel opens them correctly, and messages update from the shared store instead of polling.

04

Charts that do not depend on colour

What made it hard

Grade charts that only tell series apart by colour fail for colour-blind users, and dark mode tends to wreck the palette.

How we solved it

Separate light and dark palettes, direct labels and an HTML legend on every chart, and a table view of the same data — so nothing relies on colour alone.

06 — Screens

The real thing

Captured from the live product — the site, and the app where there is one. Select any screen to enlarge it.

The front door: what the system does, with the demo's own live counts.
Six capabilities, built around how a department actually runs a semester.
The homepage on a phone.
07 — Stack

Built with

Next.js 15
App Router, three portals
React 19
The interface
TypeScript
Strict, end to end
Zustand
The data model, persisted per visitor
Tailwind CSS
Styling and dark mode
Recharts
Accessible analytics charts
Vercel
Hosting

Services used

Where it is now

Live as a public demo

Anyone can sign in as an administrator, a faculty member or a student. The data lives in their own browser, so nothing they change touches anyone else's — and it resets from the sidebar.

Open the live site ↗(opens in a new tab)

Next case — 08MapiLeadsGoogle Maps, turned into a prospect list.Read the case study →
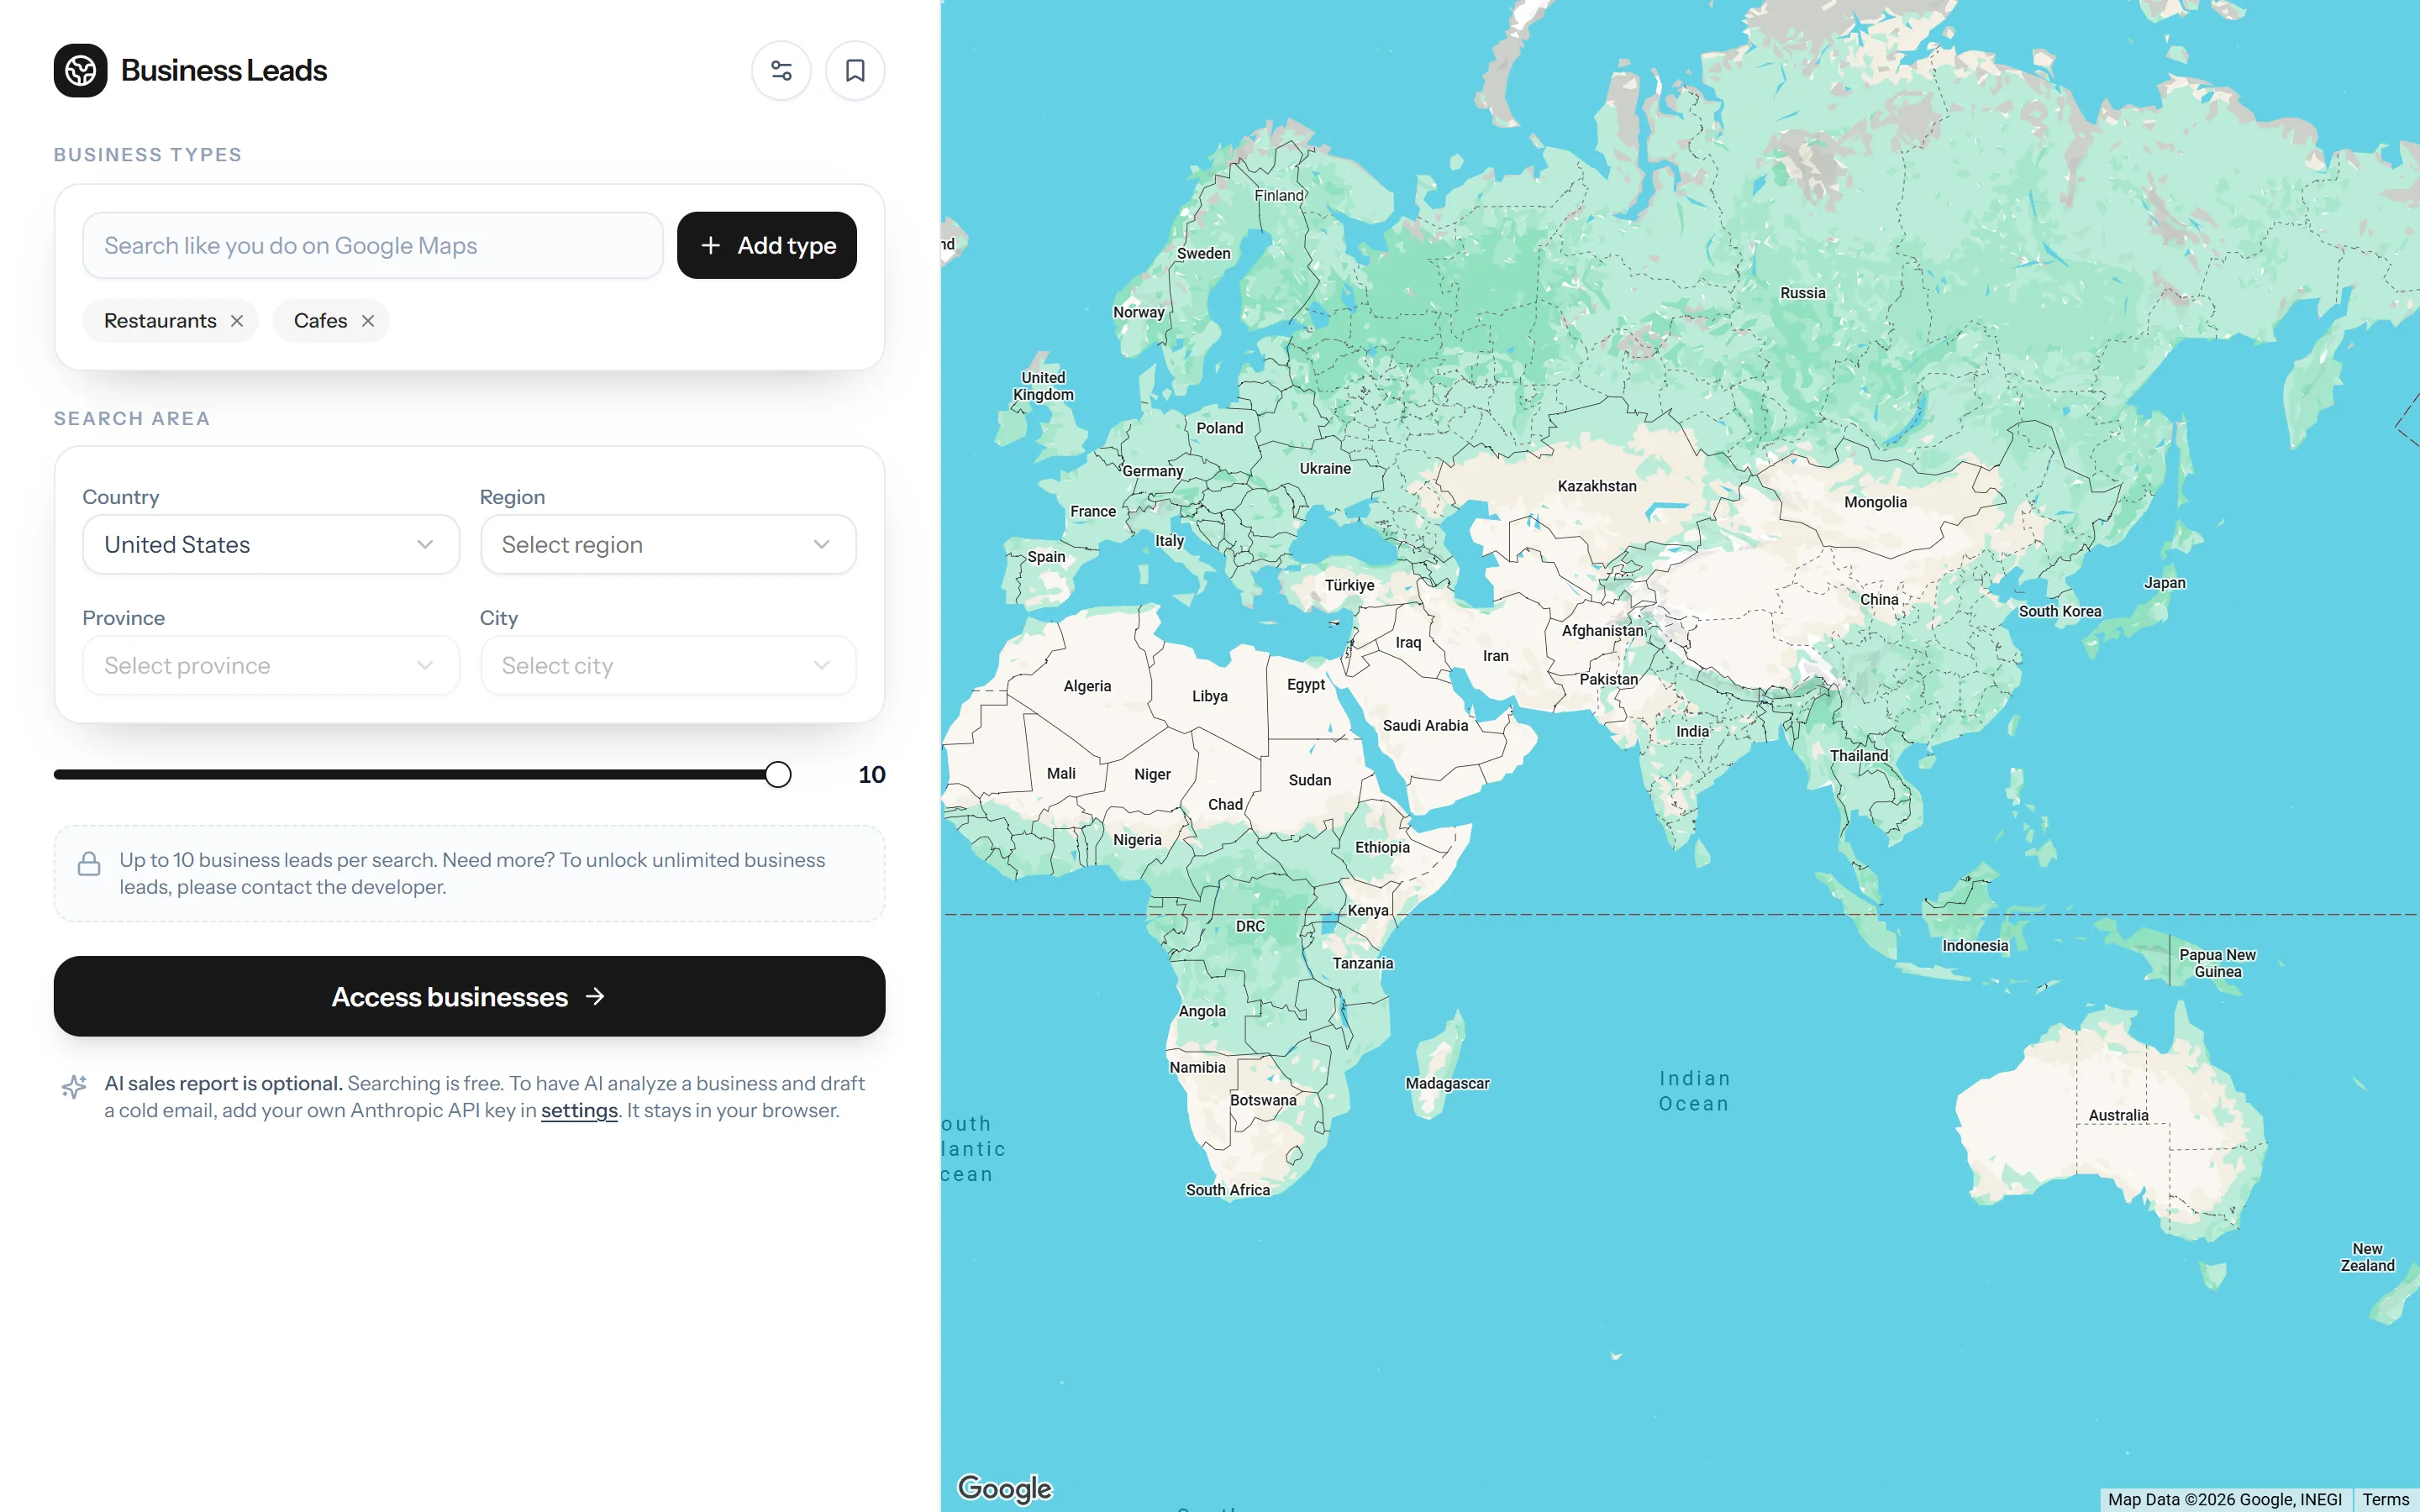
The MapiLeads search screen

Your project, on this page next year

Tell us what is not working. We'll tell you what it would take.

Start a project